
USDCHF is finally starting to show the type of price action I’ve been waiting for.
And honestly, this is a great example of why patience matters in trading.
Too many traders try to predict breakdowns before the market actually confirms them. But one thing I continue to teach inside the State of Mind Trader community is this:
Let the market show its hand first.
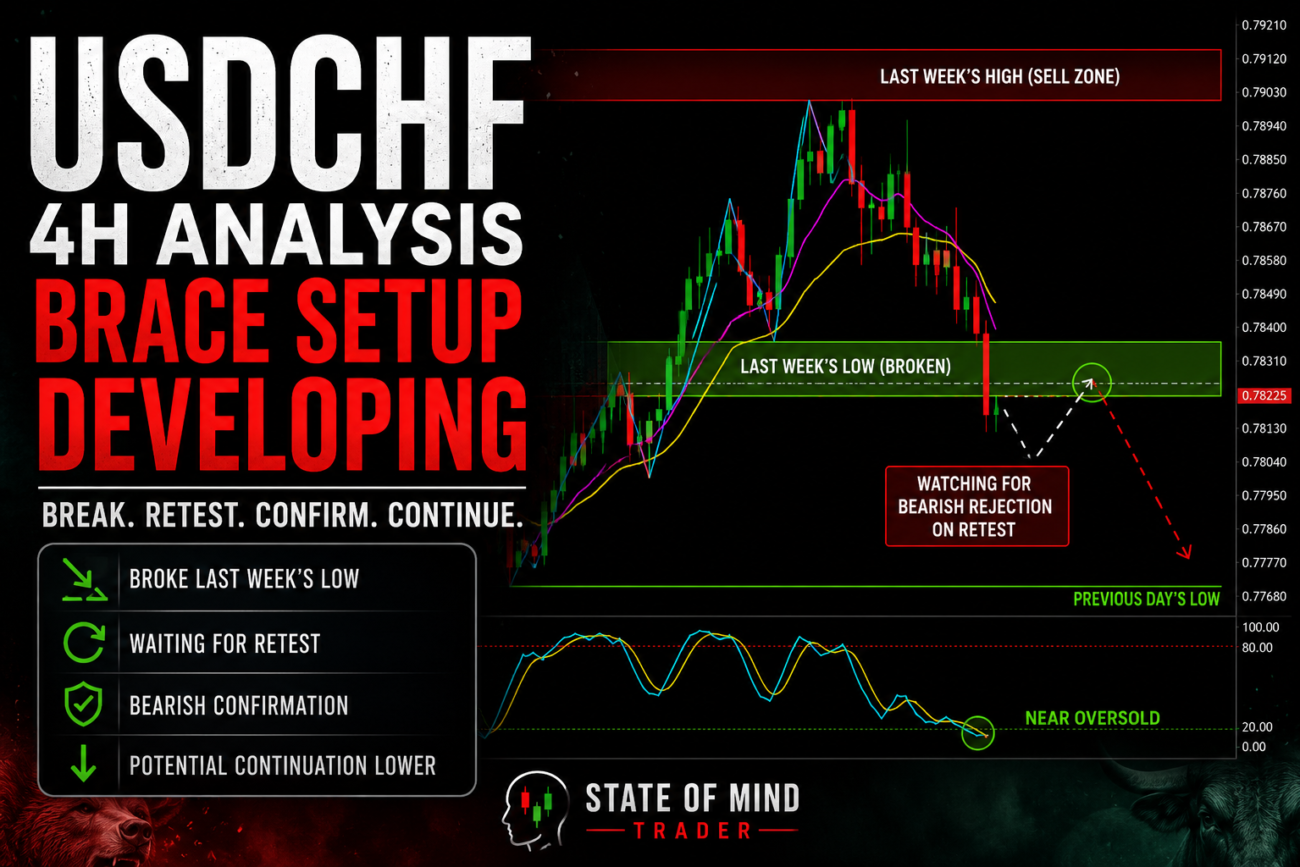
Right now on the 4-hour chart, USDCHF has officially broken beneath last week’s low zone, and that changes the entire structure of this pair.
As always, here’s how my chart is mapped out:
- The green box represents last week’s low zone
- The red box represents last week’s high zone
- The horizontal lines represent the previous day’s high and low
- The 20 EMA acts as my directional momentum filter
Up until now, price had still been attempting to hold bullish structure. But with this latest move, sellers have finally shown real momentum.
And this is where the chart becomes interesting.
Why This Breakdown Matters
The break beneath last week’s low is important because what was previously acting as support may now begin acting as resistance.
That’s one of the core principles behind the BRACE concept:
- Break
- Retest
- And Confirm Entry
Right now, I am NOT interested in chasing the breakdown candle itself.
That’s where traders often get trapped.
Price is already extended lower, stochastic is near oversold, and selling emotionally after a strong breakdown candle is usually how traders end up entering at the worst possible location.
Instead, I want to see whether the market gives a proper retest.
What I’m Watching Now
At this point, I want to see whether price pulls back upward into the broken weekly low zone and rejects it from underneath.
That would be the cleanest version of a bearish BRACE setup.
The reason I like this setup is because several things are now aligning together:
- Price is beneath the 20 EMA
- Momentum has shifted bearish
- Previous support has broken
- The market now has room to continue lower if sellers stay in control
That alignment matters.
This is no longer a chart where I’m interested in buying dips.
This is now a chart where I’m watching for bearish continuation IF the market confirms it.
What I Need to See Before Entering
Here’s exactly what I need to see before considering a sell entry:
- Price pulls back into the broken weekly low zone
- Sellers defend the retest
- Bearish confirmation forms on the 4H chart
- Price remains beneath the 20 EMA
- Momentum rotates back downward
That confirmation could come in the form of:
- bearish engulfing candles
- rejection wicks
- failed bullish continuation
- or strong bearish closes back away from the zone
Until that happens, there is no trade.
And that’s the part many traders skip.
A breakdown is not automatically an entry.
What Would Invalidate the Bearish Idea?
This part is just as important.
If price aggressively reclaims:
- the broken weekly low zone
- AND the 20 EMA
…then the bearish continuation idea weakens significantly.
At that point, the breakdown could simply become:
- a liquidity sweep
- a false breakout
- or a stop hunt before reversal
If that happens, I step aside and reassess.
No forcing trades.
No emotional entries.
No revenge trading.
Just structure and confirmation.
My Plan for USDCHF This Week
Right now, USDCHF has my attention because bearish structure is beginning to develop on the 4-hour chart.
However, I am not interested in chasing the breakdown itself.
Here’s what I need to see before entering:
- Price retests the broken weekly low zone
- Sellers reject the retest
- Price stays beneath the 20 EMA
- Bearish confirmation forms on the 4H chart
- Momentum rotates back downward
If that confirmation appears, I’ll begin looking for bearish continuation opportunities using the BRACE concept.
Until then, I wait for the market to confirm its intentions first.
Because patience is part of the strategy too.
— D. Michele
State of Mind Trader