
There are moments in the market where price is not trending, not reversing… but deciding.
What you’re looking at in this chart is one of those moments.
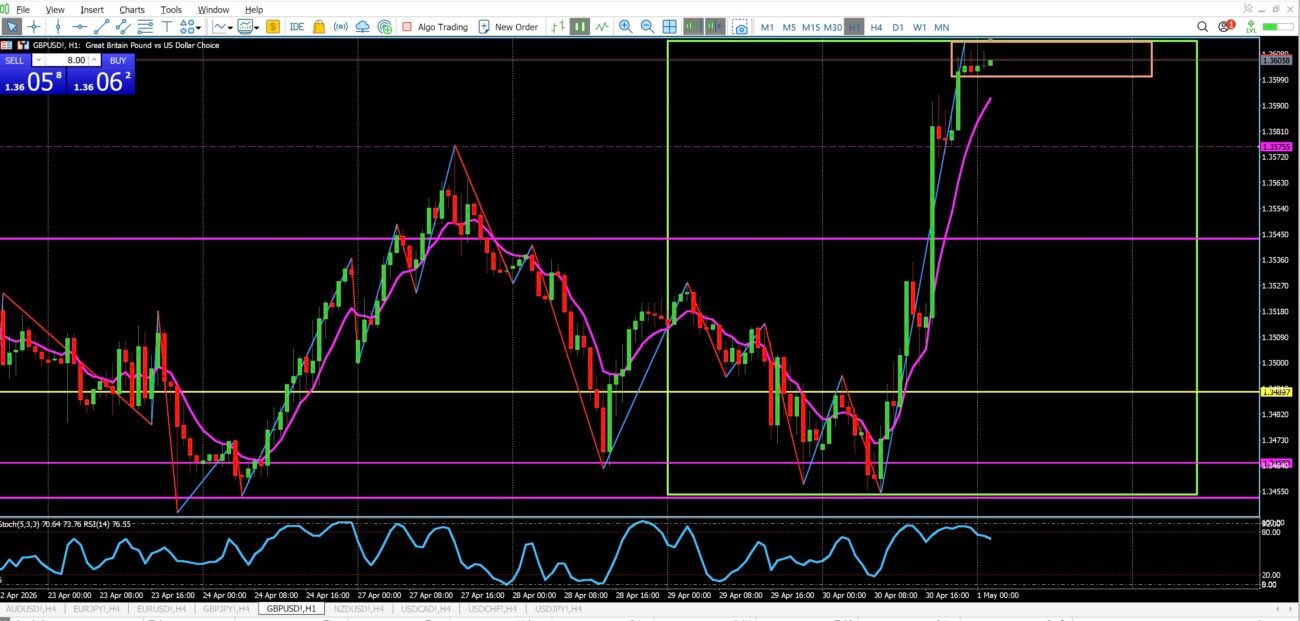
After a strong bullish push, price has now moved into a tight range at the top of the move. I’ve drawn a box around this area to highlight what we call compression.
This is not random price action. This is the market pausing at a key level. In this case, a previous monthly high and building orders before its next move.
A Quick Note on the Level
The monthly high you see marked on this chart is plotted using the daily timeframe.
I do this intentionally.
Rather than switching back and forth between timeframes, I use the daily chart to mark out my higher timeframe levels, monthly highs and lows, so they remain clean, consistent, and easy to reference when I drop down to my execution timeframes.
This keeps my charts simple while still respecting higher timeframe structure.
What the Box Represents
The box I’ve drawn around price is not just a visual aid , it’s a decision zone.
Inside this box, you’ll notice:
- Smaller candle bodies
- Reduced momentum
- Price moving sideways rather than continuing higher
This tells us one thing clearly:
The market is no longer trending, it is preparing.
Compression like this often forms when:
- Buyers are losing strength after a strong push
- Sellers are beginning to step in
- Liquidity is building on both sides of the range
In simple terms, the market is loading up before expansion.
Why This Area Matters
This compression is forming at a higher timeframe level of interest.
Price has already broken above a previous monthly high and is now retesting that area. That places this setup into ACE (Assess) territory.
Now the question becomes:
Will this level hold as resistance, or will price continue higher?
That answer does not come from guessing , it comes from waiting.
The Plan: Let the Market Confirm
At this stage, I am not entering a trade.
Instead, I am allowing the market to show its hand.
Step 1: Wait for the Break (1 Hour Timeframe)
The 1-hour chart is my execution timeframe for structure.
I want to see a clear break and close outside of this compression box. Not a wick. Not a slow drift. A decisive move with intent.
Step 2: Move to the Lower Timeframe (15 Minute)
Once the break is confirmed on the 1-hour chart, I will drop down to the 15-minute timeframe.
The purpose here is not to find a new setup, but to refine the confirmed one.
Step 3: Wait for the Retest and Confirmation
On the 15-minute chart, I will wait for:
- Price to retest the broken level (the box)
- A clear reaction at that level
- A strong confirmation candle in the direction of the break
This is where the BRACE method comes into play:
- Break
- Retest
- And Confirm Entry
No confirmation = no trade.
What If Price Runs Without the Retest?
This will happen from time to time.
And when it does, I let it go.
There is no chasing, no emotional entry, and no deviation from the plan.
Not every move is meant to be traded. Only the ones that meet your rules.
Final Thoughts
This setup is not about predicting direction.
It is about preparing for opportunity.
The compression zone you see on this chart is where the next move is likely to begin , but only a confirmed break will tell us which direction that move will take.
Until then, patience is the trade.
I was looking at this pair all day and your analysis has come in very handy! I have already entered but will monitor the market moves to analyze against the BRACE for reference! You are on point🫡
Hey Jason! thanks for the feedback. Im actually still in this trade going short. I took partial profits and moved my stop loss to break even before the market closed.