
Currently holding a buy position from last week with partial profits secured. Watching to see if buyers can continue through resistance or if price retraces from these extended levels.
Before we get into this week’s analysis, I want to provide some context regarding my current position on USDCAD.
This is not a pair that I am simply watching from the sidelines. I am currently in a buy position that was executed last Friday from the 1-hour timeframe after all BRACE requirements were met. Since entering the trade, price has moved favorably enough for me to secure partial profits, and the remaining position continues to run into the new trading week.
At this point, my remaining position is protected. My stop loss has been moved to breakeven, meaning the worst-case outcome on the remainder of the trade is that I give back nothing further while keeping the profits already secured. The market has already paid me for being right. Now my job is simply to manage what remains and allow price to tell me whether buyers have enough strength to continue higher.
As we move into the week, I think it’s important to recognize that USDCAD is approaching a decision point. While the overall trend remains bullish, price is also extended significantly above the 20-period moving average and is currently trading inside a major resistance zone. That doesn’t automatically mean the trend is ending, but it does mean I need to be realistic about the possibility of a pullback.
For now, I remain bullish, but I am also patient. The market owes me nothing at this stage.
Understanding My Chart Markings
For newer traders, let’s discuss the major levels on the chart and why they matter.
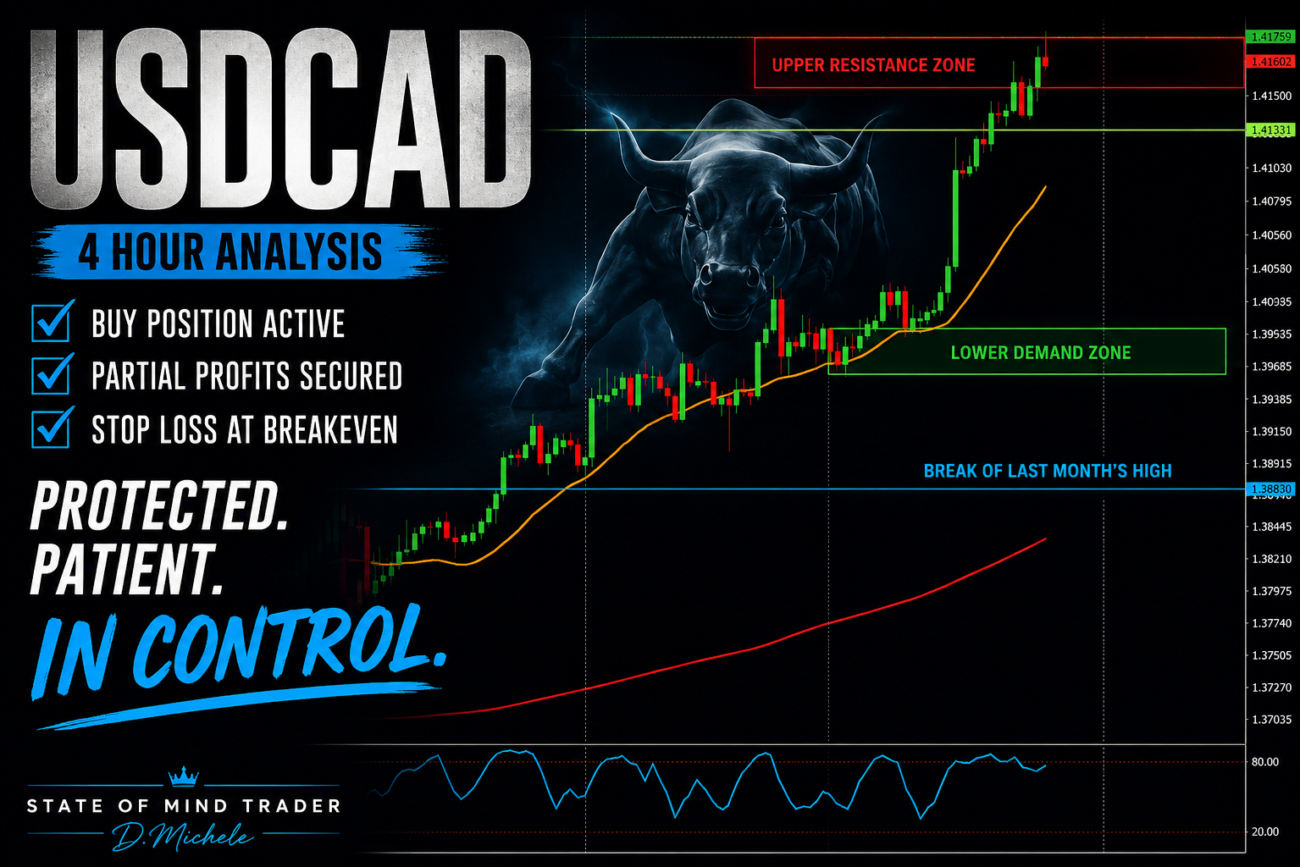
Upper Red Zone
The red zone above current price represents a major resistance area.
This is a level where sellers have previously entered the market and where price may encounter difficulty continuing higher.
Whenever price reaches an area like this, I begin paying very close attention because resistance often produces one of two outcomes:
- Buyers overwhelm sellers and continue the trend higher.
- Sellers defend the level and force a retracement.
Price is currently testing this zone.
This is one of the reasons I was comfortable securing partial profits on my existing buy position. After such a strong rally, protecting profits as price reaches a significant resistance area is simply good trade management.
Lower Green Zone
The green zone below current price represents a demand area.
This is an area where buyers previously entered the market aggressively and pushed price higher.
Should USDCAD begin to retrace, this is one of the primary areas I will be monitoring for signs that buyers are willing to defend the trend once again.
A healthy pullback into this zone would not concern me from a bullish perspective.
In fact, it could potentially create another opportunity if the proper conditions develop.
Blue Horizontal Line
The blue horizontal line represents the breakout of last month’s high.
This level is extremely important because it helps define the larger bullish structure currently in place.
Breaking above a previous monthly high is often a sign that institutions are willing to pay higher prices and that market sentiment has shifted in favor of buyers.
One of the reasons I became interested in USDCAD from the long side was because of this breakout.
The fact that price continues trading well above this level tells me buyers remain in control of the bigger picture.
What Has Already Happened
Several bullish developments have already occurred:
✔ Price broke above last month’s high.
✔ Price continues to form higher highs and higher lows.
✔ Price remains above the 20-period moving average.
✔ The 20-period moving average continues sloping upward.
✔ Momentum remains bullish.
✔ Buyers have consistently defended previous pullbacks.
All of these factors continue to support the bullish case.
What Has My Attention Right Now
The most important thing I am watching is not whether I can find another buy immediately.
The most important thing I am watching is whether buyers can maintain enough momentum to continue pushing higher from current levels.
Price has rallied significantly.
The distance between current price and the 20-period moving average has expanded considerably.
Markets do not move in a straight line forever.
Eventually, price either consolidates or retraces.
Because of that, I think patience is extremely important right now.
The market is essentially asking a question:
Do buyers have enough strength to break through resistance and continue higher?
Or will sellers force a retracement?
The answer to that question will likely determine what happens next with my remaining position.
What Is BRACE?
For newer readers, BRACE is the framework I use when evaluating potential trade entries.
B – Breakout
Price breaks a significant level.
R – Retrace
Price returns to test the breakout area.
A – And
This simply connects the next step in the process.
C – Confirm
A confirmation candle forms and closes in the direction of the anticipated move.
E – Execute
The trade is entered on the next candle following confirmation.
My current buy position was executed after these requirements were met on the 1-hour chart while remaining aligned with the larger bullish structure.
What Would I Like To See Next?
My preferred scenario would be one of two things:
Scenario One
Buyers break above the current resistance zone and continue higher.
If that occurs, my existing position benefits from the continuation.
Scenario Two
Price retraces into support and develops a fresh BRACE opportunity.
This could occur near the 20-period moving average, a previous breakout level, or the lower demand zone.
Either outcome would be acceptable.
What I am not interested in doing is chasing price while it is already extended into resistance.
What Would Change My Bias?
At the moment, very little.
For me to become bearish, I would need to see:
- Significant rejection from resistance.
- A break of bullish market structure.
- Lower highs and lower lows begin forming.
- Failure of key support levels.
- Bearish confirmation following the breakdown.
None of those conditions currently exist.
A pullback by itself is not a reason to become bearish.
A pullback is simply part of how healthy trends move.
Final Thoughts
The overall structure on USDCAD remains bullish.
However, I also recognize that price is currently extended above the 20-period moving average and trading inside a significant resistance zone.
Because of that, this is not a place where I am eager to force new entries.
Instead, I am focused on managing the buy position I already have, protecting the profits already secured, and allowing the market to determine whether buyers can continue the move higher.
If price continues higher, I benefit from the remaining position.
If price reverses and stops me out at breakeven, I still walk away with the profits already secured.
Either way, I remain protected.
As always, while my directional analysis comes from the 4-hour chart, traders can still use the 1-hour chart for execution, provided market structure and the full BRACE process remain aligned.
Remember, our job is not to predict.
Our job is to observe, wait for confirmation, and respond to what price actually does.
— D. Michele
State of Mind Trader